
What 'Housing Market' Actually Means - And Why It Varies by ZIP Code
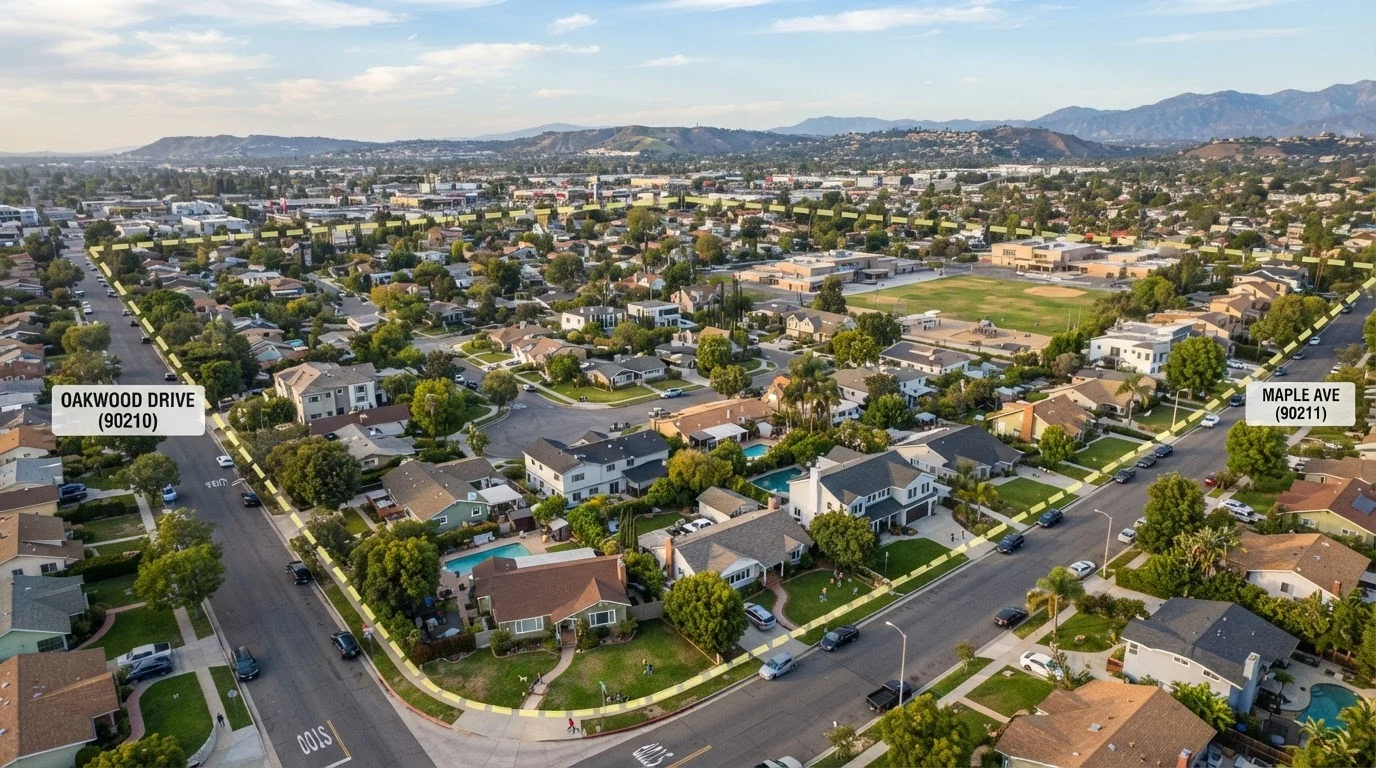
Photo credit: FaqInsider.com
In this article
The housing market isn't one thing. Learn what drives local price differences and why national headlines rarely tell the whole story.
Key Takeaways
- National housing market headlines reflect averages that may not apply to your ZIP code.
- Local supply, employment, school quality, and zoning rules drive neighborhood-level price differences.
- A 'buyer's market' in one city can coexist with a 'seller's market' just miles away.
- Understanding local market conditions - not national trends - is what helps buyers and sellers make better decisions.
- Median sale price and days on market are more useful signals than broad news coverage.
Why 'The Housing Market' Is a Misleading Phrase
Turn on the news during any period of real estate activity and you'll hear confident declarations: the housing market is cooling, heating up, correcting, or booming. These statements aren't wrong, exactly - they're just describing a national average that may bear little resemblance to what's happening on your street.
The United States has no single housing market. What analysts call "the market" is actually an aggregation of millions of individual transactions across thousands of distinct local economies. A metro area experiencing rapid price growth can contain ZIP codes where homes sit unsold for months. Understanding this distinction is the starting point for making sense of any real estate decision.
For a broader framework on how all these pieces connect, this complete guide to understanding the housing market walks through the full picture from national trends to neighborhood data.
~3,000+
Distinct U.S. housing markets tracked by county
The National Association of Realtors and federal housing agencies monitor real estate activity across more than 3,000 U.S. counties, each with its own supply-and-demand dynamics.
Up to 30%
Price premium for top school district homes
Research published by the National Bureau of Economic Research has found that homes in higher-rated school districts command substantial price premiums compared to similar homes just across district boundaries.
~6 months
Inventory needed for a balanced market
Real estate economists generally consider six months of available housing supply to represent a balanced market; below this threshold, conditions tend to favor sellers.
What Actually Drives Price Differences by ZIP Code
Several interconnected forces shape home values at the local level - and they can diverge sharply even between adjacent neighborhoods.
- Employment concentration: ZIP codes near major employers or employment corridors typically see stronger demand. When a large company opens or closes a regional office, nearby housing values often respond within quarters.
- School district boundaries: In many parts of the U.S., school quality ratings directly influence buyer willingness to pay a premium. A boundary line between two school districts can translate into tens of thousands of dollars in price difference for nearly identical homes.
- Housing supply and zoning: Areas with restrictive zoning that limits new construction tend to see prices rise faster when demand increases. High-density zoning or active new development can dampen price appreciation even in desirable locations.
- Walkability and infrastructure: Access to transit, parks, grocery stores, and other amenities contributes measurably to demand in many markets.
These variables interact differently in every ZIP code, which is why the market can vary block by block within a single city.
The Danger of Letting Headlines Drive Local Decisions
National real estate coverage serves an important purpose - it signals the direction of mortgage rates, builder sentiment, and broad affordability trends. But it's a poor substitute for local market knowledge when you're deciding whether to buy, sell, or wait.
Consider a scenario where national headlines report a 5% decline in median home prices. In a market with constrained supply and growing employment, local prices may be flat or even rising during the same period. A buyer who delays because of negative headlines could miss favorable local conditions. The reverse is equally true.
Acting on broad housing headlines rather than local data is one of the most common - and costly - mistakes buyers and sellers make.
Track Local Metrics, Not Just Headlines
Before making any buying or selling decision, look up the median days on market and active listing count for your specific ZIP code over the past three to six months. Free tools from county assessor offices and public MLS aggregators can provide this data without any cost. Consistent local tracking is more valuable than any single news report.
How to Think About Your Local Market
Shifting focus from national noise to local signal requires looking at a handful of specific metrics consistently over time. Days on market - how long a home sits before going under contract - tells you whether demand is outpacing supply in a given area. Active inventory levels show whether buyers have genuine choice or are competing for scarce listings. Median sale price relative to list price reveals whether sellers are getting their asking price or making concessions.
These metrics, tracked at the ZIP code or neighborhood level, paint a far more accurate picture than any national headline. Reading a housing market report doesn't require a real estate license - it requires knowing which numbers to look for and what they signal.
When evaluating any market, the most useful question isn't "Is the housing market good or bad?" It's "What is happening in this specific area, and does that align with my timeline and financial situation?"
This article is for general informational purposes only and does not constitute financial, investment, or real estate advice. Consult a licensed real estate professional or financial adviser for guidance specific to your circumstances.
Frequently Asked Questions

Author
Real Estate Editorial Team
Real Estate Editorial Team is the collective byline for our editorial team and contributor network. Articles published under this byline or an editorial pen name are researched, written, and reviewed according to our editorial standards for clarity, consistency, and independence before publication.
View all articles →